
A sales pipeline can look healthy on Monday and become questionable by Friday. Deals slip, close dates change, buyers stop responding, and confident forecasts begin to unravel.
AI sales forecasting addresses this problem by analyzing historical sales results, current opportunities, customer activity, salesperson behavior, and external signals. It estimates future revenue and highlights the deals, territories, or periods carrying the most risk.
However, AI does not make uncertainty disappear. Forecast quality still depends on clean CRM data, realistic sales processes, suitable models, and regular human review.
This article is especially useful for sales leaders, revenue operations teams, CRM administrators, founders, CFOs, and technology decision-makers evaluating predictive sales analytics.
Quick Answer: How Does AI Sales Forecasting Work?
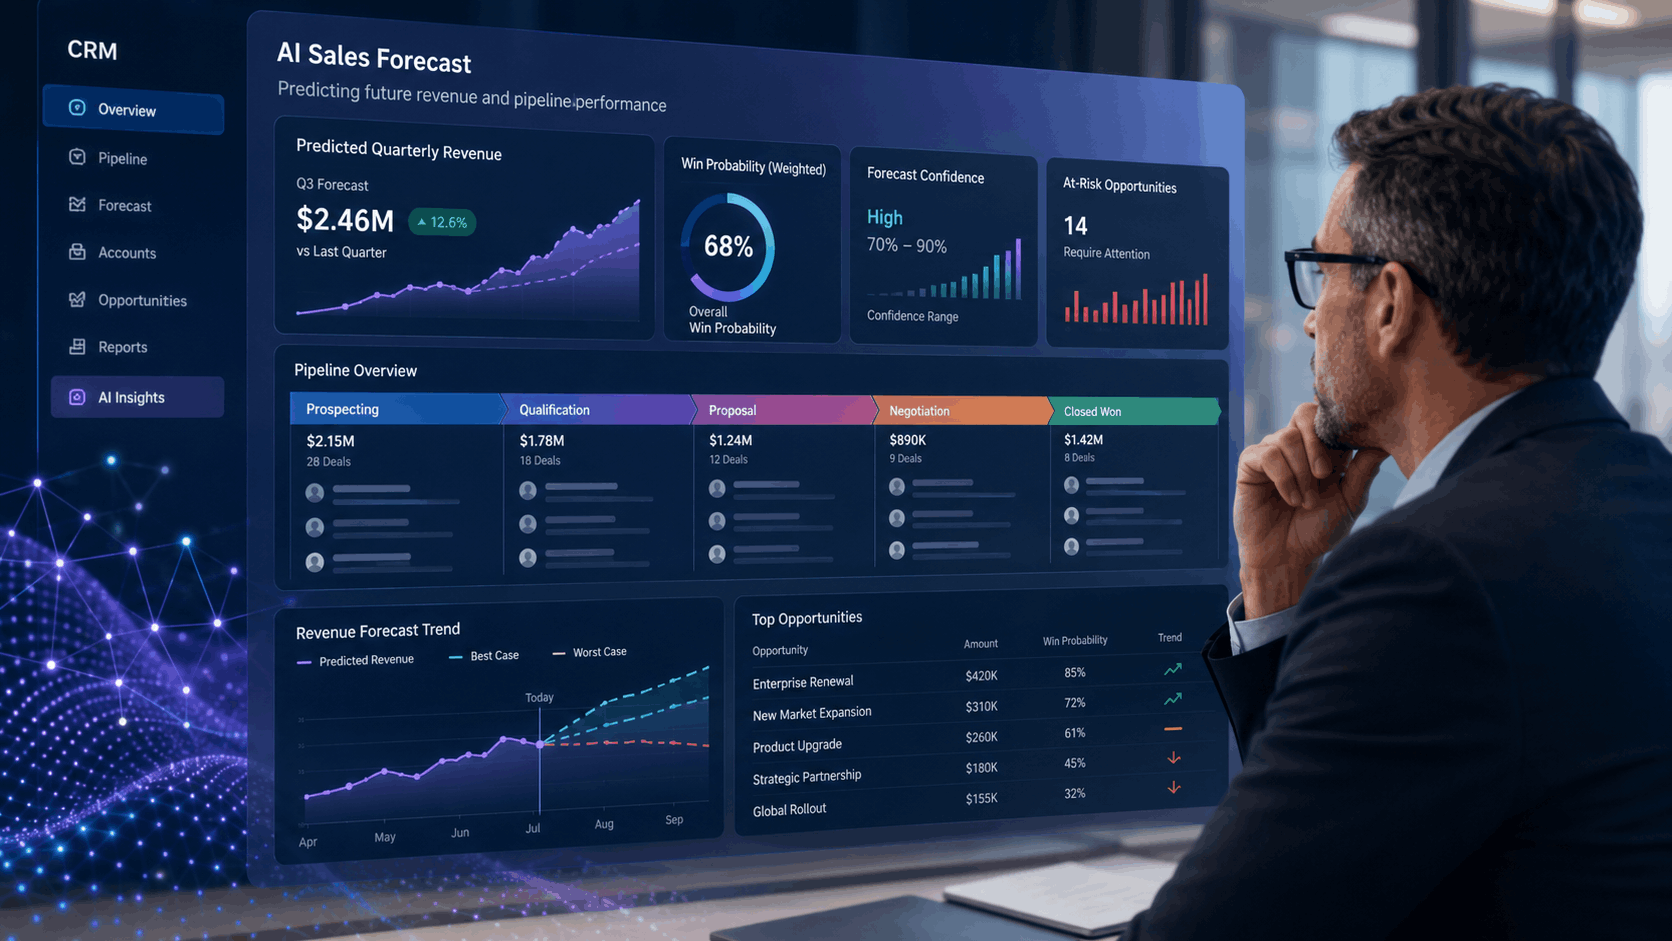
AI sales forecasting uses machine learning and statistical models to identify patterns in historical and current sales data. It estimates likely revenue, deal-closing probability, expected close dates, and forecast ranges. The predictions then appear inside the CRM, where managers can compare them with salesperson commitments and take action on pipeline risks.
Microsoft describes predictive forecasting as using historical performance and current pipeline trajectory to estimate the revenue a business is likely to close. Salesforce similarly analyzes opportunity history, account data, activities, win rates, and other factors to produce revenue predictions and confidence ranges.
What Is AI Sales Forecasting?
AI sales forecasting is the use of predictive models to estimate future sales outcomes from business data.
Traditional forecasting commonly relies on pipeline value, fixed stage probabilities, spreadsheets, and sales-representative judgment. For example, a CRM may assign every proposal-stage opportunity a 60% probability and calculate weighted pipeline accordingly.
An AI model goes further. It can examine whether similar opportunities actually closed, how quickly the buyer is moving, whether key stakeholders are involved, how recently the rep followed up, and whether the expected close date has already changed several times.
The result may include:
- Predicted revenue for the month or quarter
- Probability that each opportunity will close
- Expected deal-closing dates
- Forecast ranges rather than one fixed number
- Deals likely to slip into a later period
- Pipeline gaps by team, territory, product, or salesperson
- Factors influencing each prediction
AI forecasting should support management judgment, not replace it. Sales leaders still know about contract negotiations, budget freezes, procurement delays, and customer conversations that may not yet appear in structured CRM fields.
What Real Deployments Show
SAP has documented a case where Sybit, a professional-services company that previously had limited visibility into sales KPIs, modernized its sales operation with an intelligent forecasting solution and reported a large productivity increase along with better conversion rates and greater forecast transparency. SAP documents this and similar examples.
The pattern across documented deployments is consistent with the six-stage process below: the gains come from combining cleaner data with a model, not from the model alone.
How AI Sales Forecasting Turns Data Into Predictions
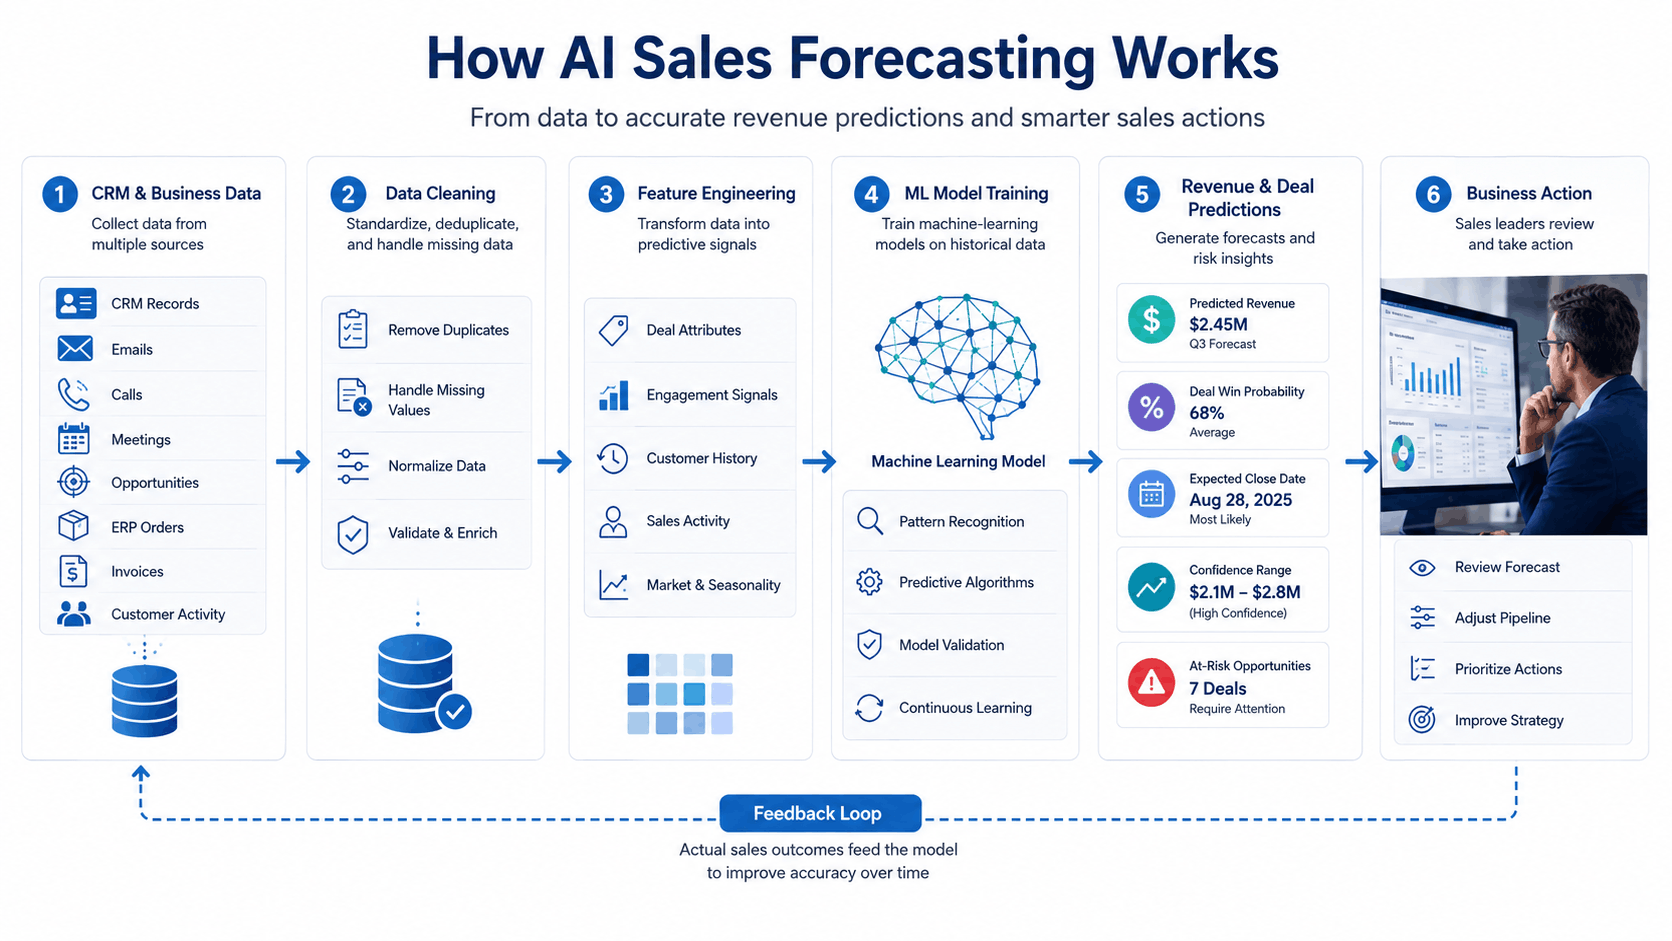
Most forecasting systems follow a six-stage process.
1. Data Is Collected
The model receives historical and current data from the CRM and connected systems.
Typical sources include:
- Leads, accounts, contacts, and opportunities
- Deal amount, stage, probability, and expected close date
- Stage-entry and stage-exit timestamps
- Won and lost opportunities
- Emails, calls, meetings, and follow-up activity
- Quotations, proposals, contracts, and approvals
- Products, pricing, discounts, and order history
- Marketing source and campaign engagement
- Salesperson, territory, industry, and account segment
- ERP, billing, support, or product-usage data
CRM data normally provides the core pipeline information. However, ERP and finance integrations may confirm whether orders were invoiced, canceled, delayed, or paid.
2. Data Is Cleaned and Standardized
Raw CRM data is rarely ready for modeling.
Duplicate opportunities, outdated close dates, inconsistent stage names, missing deal values, and inactive records can distort a forecast. Therefore, the system may standardize fields, remove duplicates, identify missing values, and exclude records that do not meet quality rules.
This stage often affects accuracy more than choosing between two advanced algorithms. A sophisticated model cannot reliably interpret a pipeline where half the opportunities have not been updated for 90 days.
3. Forecasting Features Are Created
A feature is an input used by the model.
The original CRM field may be useful, but derived features often provide more context. Examples include:
- Days spent in the current stage
- Number of close-date changes
- Days since the last meaningful interaction
- Ratio of completed to overdue activities
- Average historical sales-cycle length
- Rep win rate for similar opportunities
- Number of engaged buyer stakeholders
- Discount compared with typical won deals
- Opportunity value compared with the account’s purchase history
- Stage velocity relative to successful deals
This process is called feature engineering. It converts routine CRM records into signals that help the model distinguish real momentum from optimistic data entry.
4. A Model Is Trained
The model learns from historical examples.
For opportunity-level forecasting, the training dataset may label past deals as won, lost, delayed, or closed in a particular period. The model then identifies combinations of factors associated with those results.
For time-based revenue forecasting, the model may study monthly or weekly sales totals, seasonality, promotions, product demand, economic cycles, and growth trends.
Historical data is usually divided into training and validation periods. Time-based splitting is important because using future information to predict the past creates data leakage and misleadingly strong results.
5. Predictions Are Generated
Once trained, the model scores current opportunities or predicts total revenue.
A forecast might show:
- Salesperson commitment: $850,000
- Stage-weighted pipeline estimate: $790,000
- AI-predicted revenue: $710,000
- Expected range: $660,000 to $760,000
That difference creates a useful management question: which deals explain the gap?
Salesforce’s forecasting tools can display prediction ranges and influential factors. Microsoft keeps AI-predicted revenue separate from manual “Committed” and “Best Case” forecasts, allowing leaders to compare model output with team judgment.
6. Actual Results Feed Back Into the Model
After the forecast period ends, actual results are compared with predictions.
The organization can measure errors, investigate unusual misses, retrain the model, and adjust business rules. This feedback loop matters because buyer behavior, products, territories, sales teams, and economic conditions change.
A model that performed well last year may gradually lose accuracy. This is known as model drift.
Which Models Are Used for Predictive Sales Analytics?
There is no universal “best” forecasting model. The right choice depends on the prediction target, data volume, sales cycle, and required level of explanation.
|
Model type |
Best suited for | Strengths |
Limitations |
|---|---|---|---|
|
Linear or logistic regression |
Revenue prediction and win probability | Fast, understandable, and easy to audit |
May miss complex relationships |
|
Time-series models |
Weekly, monthly, or seasonal sales | Good for trends and recurring patterns |
May ignore deal-level CRM behavior |
|
Decision trees and random forests |
Opportunity scoring and mixed CRM data | Capture nonlinear relationships |
Large models can be harder to explain |
|
Gradient boosting |
Detailed predictive sales analytics | Often strong on structured business data |
Requires tuning and careful monitoring |
|
Neural networks |
Large, complex, multichannel datasets | Can identify subtle patterns |
Data-intensive and less transparent |
|
Ensemble models |
Combining several forecast methods | Can improve stability across conditions |
More complex to operate and explain |
Many practical systems combine approaches. A time-series model may forecast total quarterly revenue, while a classification model estimates which open opportunities will contribute to that total.
The most complex model is not always the most useful. A simpler model with transparent factors may earn more trust from sales managers and be easier to govern.
Native CRM AI vs. Specialized Forecasting Tools
Two broad categories exist in the market. Native forecasting features built into major CRMs (such as Salesforce Einstein or Microsoft Dynamics 365 predictive forecasting) use the data already inside that CRM and require little separate setup. Specialized revenue-intelligence platforms add capabilities like conversation analysis from calls and emails, or automated activity capture, on top of an existing CRM. Neither category is automatically better — native tools are usually faster to enable and lower-risk, while specialized platforms can add value when a business needs deeper conversation-level signals or has already exhausted what native forecasting can see in structured fields alone.
What Determines AI Sales Forecasting Accuracy?
Accuracy is not simply a model percentage displayed on a dashboard. It must be measured against actual results over several forecast periods.
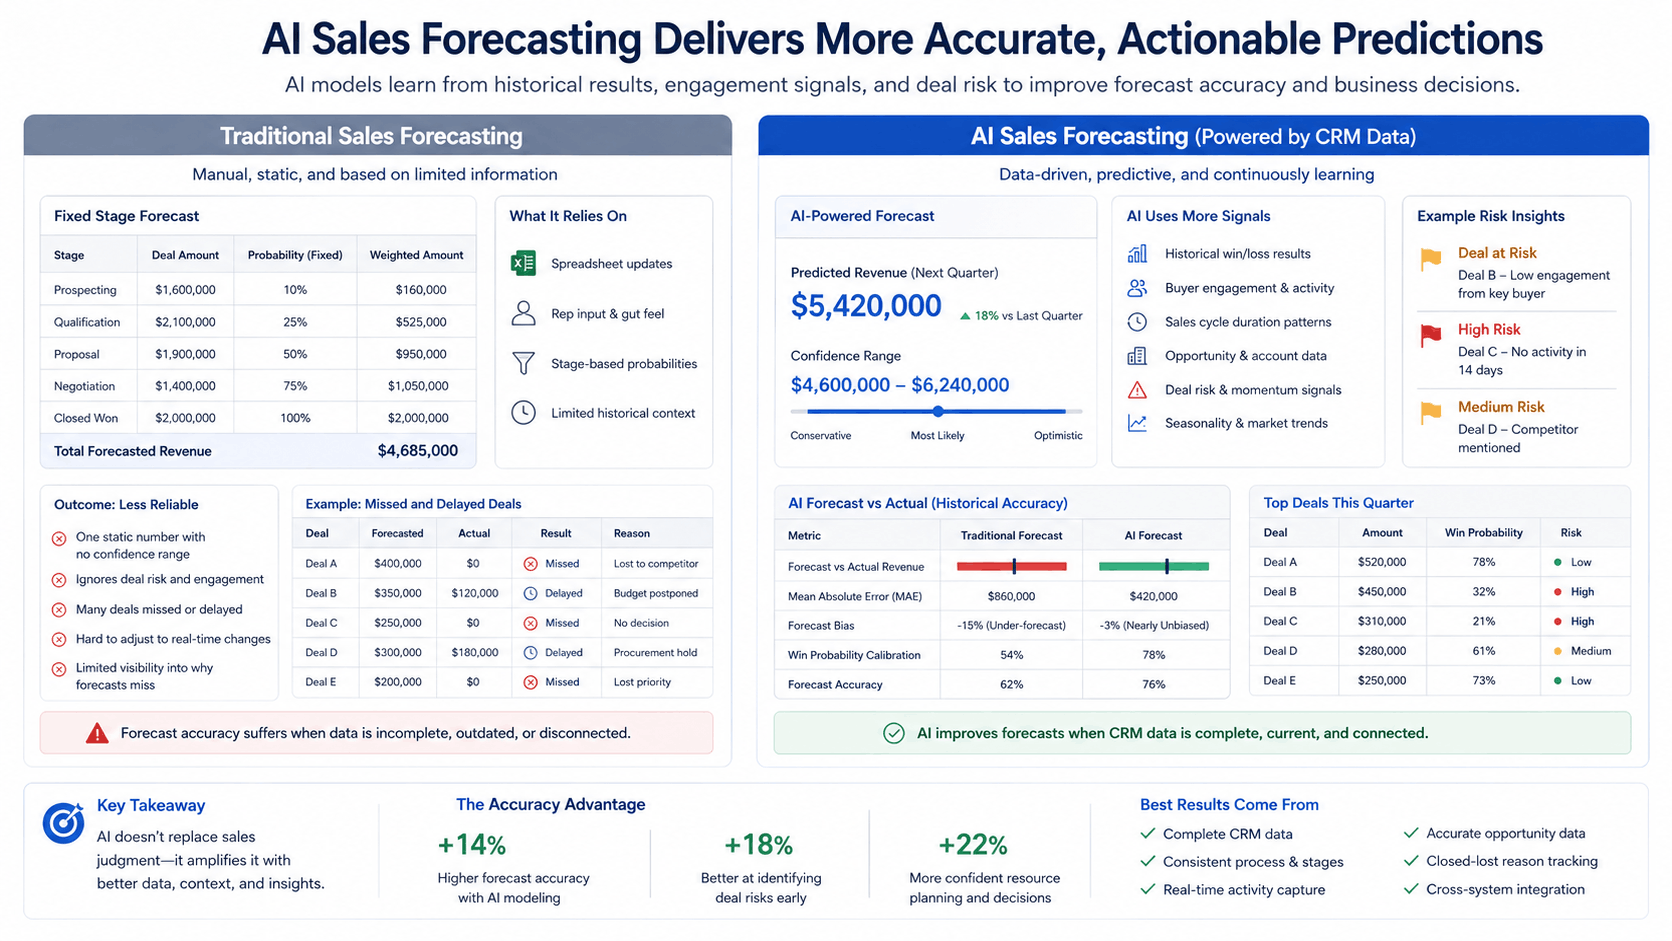
Common metrics include:
|
Metric |
What it measures |
When it is useful |
|---|---|---|
| Mean Absolute Error | Average difference between actual and predicted revenue |
Easy business interpretation |
|
Mean Absolute Percentage Error |
Average relative error as a percentage |
Comparing periods of different sizes |
|
Root Mean Squared Error |
Error with larger misses penalized more heavily |
When major forecast misses are especially costly |
|
Forecast bias |
Whether predictions consistently run high or low |
Detecting systematic optimism or conservatism |
|
Win-probability calibration |
Whether predicted probabilities match actual win rates |
Opportunity-level forecasting |
Scikit-learn documents MAE, MAPE, MSE, and RMSE as standard regression-evaluation metrics. RMSE remains in the same unit as the prediction target and gives greater weight to larger errors.
Businesses should also compare AI performance with a baseline. Useful baselines include last month’s sales, the same quarter last year, weighted pipeline, and manager-submitted forecasts. A model that sounds advanced but cannot outperform a simple baseline has limited practical value.
Factors That Improve Accuracy
Forecasts usually become more dependable when:
- Sales stages have clear entry and exit criteria.
- Opportunities are updated consistently.
- Lost reasons are recorded accurately.
- Historical data covers several sales cycles.
- Separate models are used for very different products or regions.
- Exceptional events are marked rather than treated as normal behavior.
- Model performance is reviewed by segment and forecast period.
- Managers can explain and challenge individual predictions.
HubSpot explicitly notes that its AI forecast accuracy depends on CRM data being accurate, correct, and current. Microsoft also leaves the prediction blank when there is insufficient data for predictive forecasting.
A Note for SaaS Businesses
Subscription businesses forecast a somewhat different set of outcomes than one-time-sale businesses. Alongside new-deal revenue, SaaS forecasting models commonly predict renewal likelihood, expansion or upsell revenue, and churn risk — often using product-usage data (login frequency, feature adoption, support-ticket volume) as inputs alongside the CRM fields already described above. The same six-stage process applies; the main difference is which outcomes the model is trained to predict and which additional data sources feed it.
How CRM Sales Forecasting Integration Works
A useful forecasting model belongs inside the CRM workflow; not in a separate data-science report that sales managers rarely open.
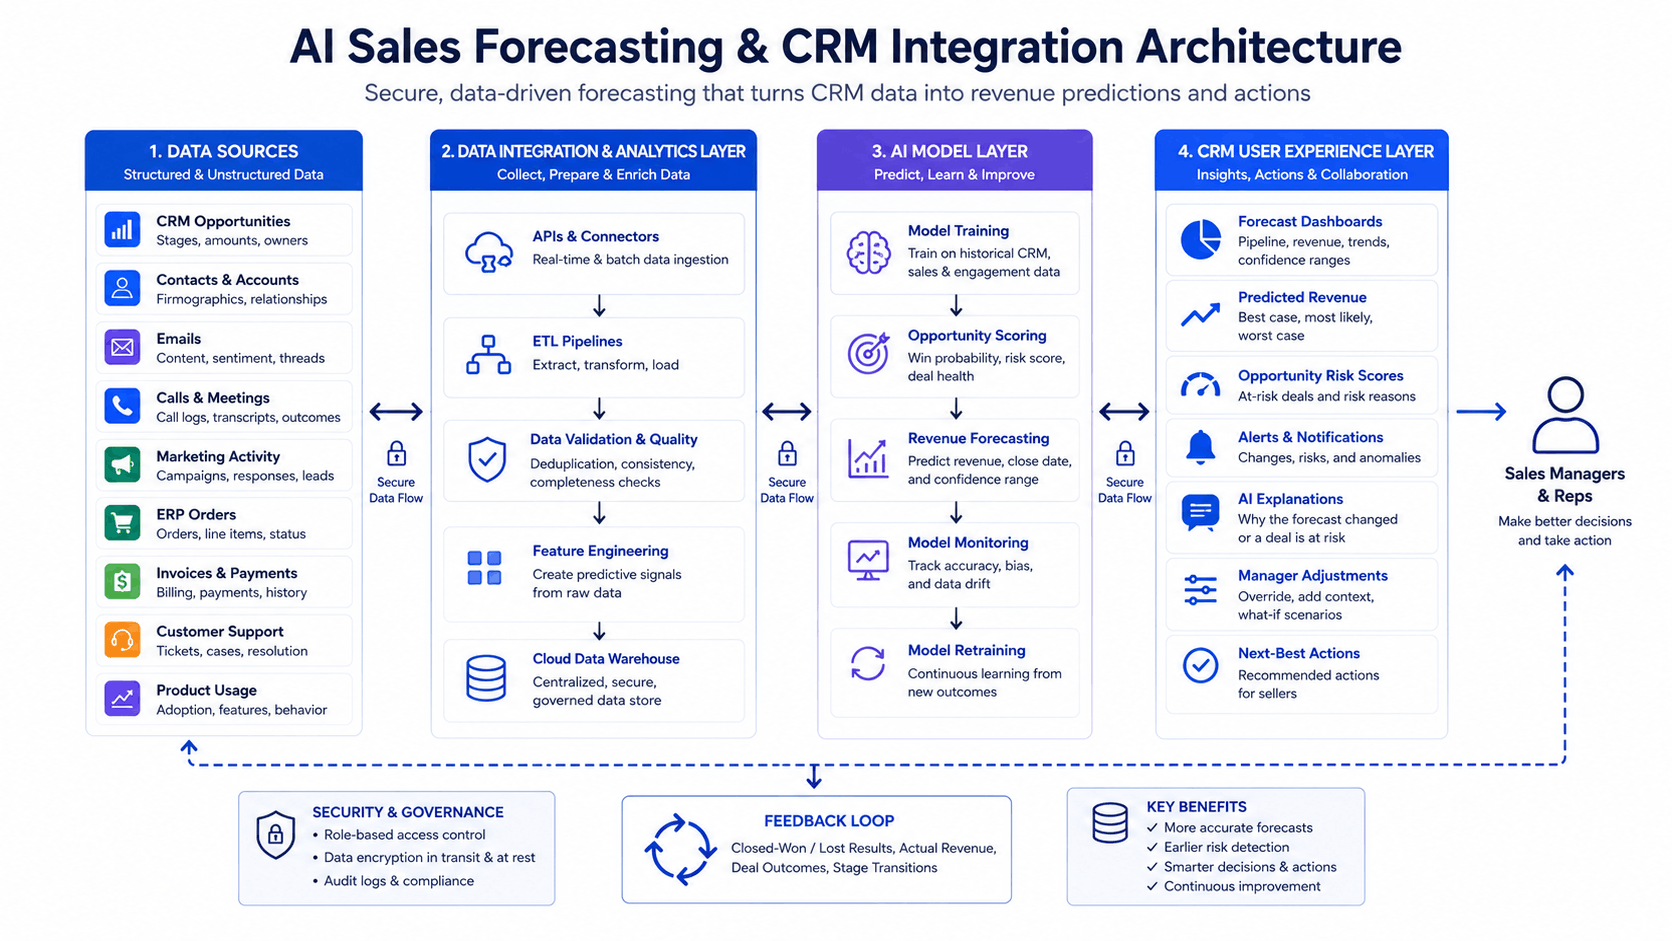
A typical architecture includes four layers.
Data Layer
CRM records form the main dataset. APIs or scheduled pipelines may also collect ERP orders, invoices, marketing engagement, customer-support activity, and product-usage signals.
Analytics Layer
A data warehouse or dedicated analytics database stores cleaned historical records. Data pipelines calculate features, prepare training datasets, and preserve forecast snapshots.
Model Layer
The model trains on historical outcomes and generates predictions through scheduled batch processing or a prediction API. Model versions, performance metrics, and training dates should be recorded.
CRM Experience Layer
Predictions return to the CRM as fields, dashboards, alerts, and management views. Salespeople may see win probability, risk reasons, next-best actions, and predicted close dates directly on the opportunity.
The integration should also preserve human input. HubSpot, for example, allows forecast submissions based on seller knowledge alongside stage-based forecasting, while Microsoft supports manual adjustments for information not yet captured in opportunity records.
Businesses planning broader CRM modernization can review Kanhasoft’s custom CRM development services. For a broader look at AI features across CRM beyond forecasting specifically — lead scoring, personalization, and general predictive analytics — see Kanhasoft’s guide to AI-driven CRM predictive analytics.
A Practical CRM Forecasting Scenario
Consider a B2B software company with 800 open opportunities.
Its existing forecast multiplies deal value by a fixed stage probability. Every proposal-stage deal receives the same weighting, although some have active executive involvement and others have not received a reply in three weeks.
An AI model can distinguish between them by analyzing engagement, stage duration, close-date movement, deal size, account fit, rep history, and patterns from past outcomes.
The company may discover that:
- Several “committed” deals resemble previously delayed opportunities.
- Smaller opportunities with active stakeholder engagement have stronger closing patterns.
- One territory is consistently overestimating late-stage pipeline.
- A certain lead source converts well but takes longer to close.
- Discounting beyond a particular range correlates with slower approvals.
The prediction does not close the deals. It tells managers where coaching, escalation, pricing support, or pipeline development may be needed.
A related Kanhasoft CRM implementation centralized leads, pipelines, automated follow-ups, communications, and reporting dashboards. That type of structured CRM foundation is essential before dependable forecasting can be added; the case study itself does not claim that an AI forecasting model was included.
Native CRM Forecasting or a Custom Model?
|
Business situation |
Practical starting point |
|---|---|
|
Standard sales process using one major CRM |
Evaluate the CRM’s native forecasting first |
|
Limited historical data |
Improve data discipline and use simple baselines |
|
Several pipelines with different behavior |
Consider segmented or custom models |
|
Forecast requires ERP, billing, usage, or external data |
Use an integrated analytics architecture |
|
Highly regulated or high-impact decisions |
Prioritize explain ability, access controls, audit logs, and human approval |
|
Unique pricing, channel, or contract workflows |
Consider custom CRM sales forecasting |
Native tools may offer faster deployment and lower technical overhead. Custom models provide more control over data, segmentation, integrations, and business-specific logic.
The right choice depends on whether the native forecast answers the organization’s actual questions; not on whether custom AI sounds more advanced.
Implementation Risks and Governance
AI forecasting can create false confidence when teams treat its output as objective truth.
Important risks include:
- Historical bias being repeated in future predictions
- Poor CRM adoption weakening the training data
- Data leakage creating unrealistic test results
- Sudden market changes invalidating historical patterns
- Sensitive customer or employee data being used unnecessarily
- Managers acting on predictions they cannot explain
- Forecast scores becoming targets that employees manipulate
Practical controls include role-based access, documented data sources, model-version tracking, prediction explanations, performance monitoring, retraining rules, and human approval for high-impact decisions.
The NIST AI Risk Management Framework recommends managing trustworthiness throughout the design, development, use, and evaluation of AI systems. Organizations in regulated industries should also involve qualified data privacy, security, legal, and compliance professionals.
The pace of this shift is significant: Gartner expects a majority of seller work to be executed by generative AI technologies within five years of its 2023 forecast, which is exactly why the governance controls above matter now rather than later.
Conclusion
AI sales forecasting works best as a disciplined decision-support system. It combines historical outcomes, current CRM activity, predictive models, accuracy testing, and human judgment to create a more realistic view of future revenue.
The technology can expose pipeline risk earlier and reduce dependence on fixed stage probabilities. However, success begins with reliable data, clear sales processes, and measurable business questions.
Before investing in advanced predictive sales analytics, decide what the forecast must predict, which decisions it should improve, and how users will act on the result.
Planning an AI-Ready CRM Forecasting Roadmap?
Kanhasoft can help assess your sales process, CRM data quality, integration requirements, reporting needs, and forecasting use cases before recommending a practical solution.
The goal may be to improve an existing CRM forecast, connect sales and ERP data, or develop a custom predictive layer. A focused discovery phase can clarify what data is available, which model approach is realistic, and how predictions should fit into daily sales management.
Explore AI-powered custom CRM development or discuss your requirements through the Kanhasoft contact page.